The Wikipedia Graph

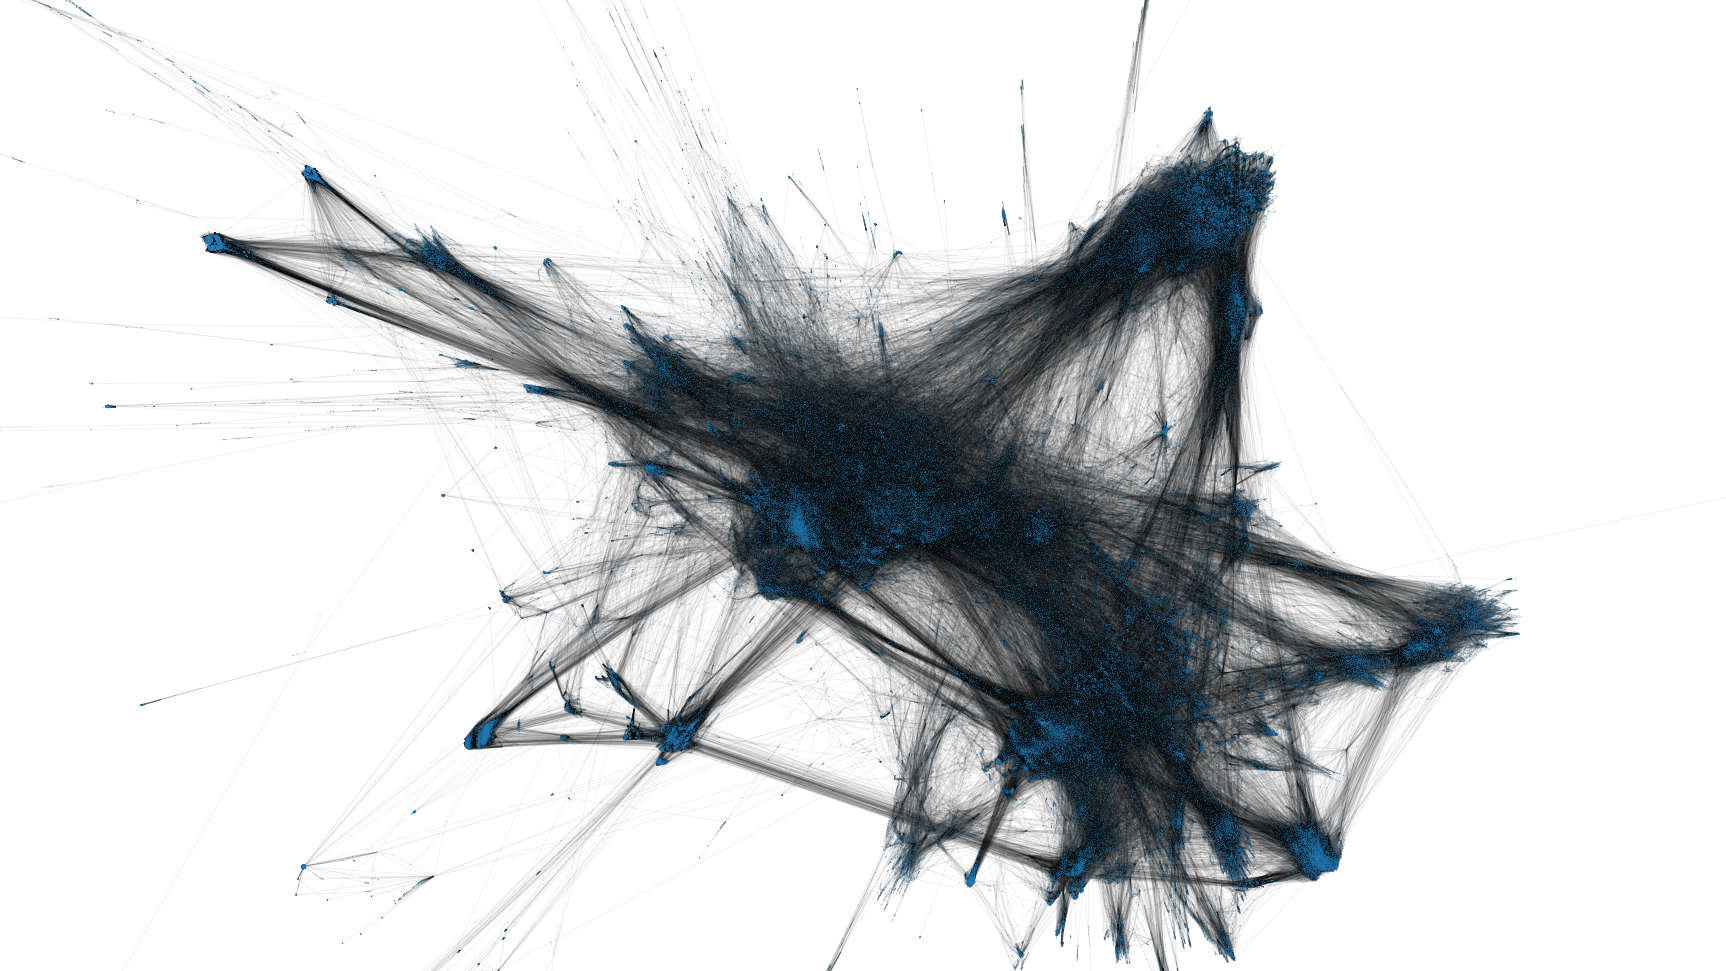
I've spent the latest days playing around categories in Italian Wikipedia, in the aim to chart them and get a visualization of a semantic graph composed by more than 440K nodes. I've not reached any acceptable nor useful result, but it is worth to document what actually worked and what not.
First of all: obtain the categories' list. Due the extreme openess of Wikipedia's project, it is easy: here are the dumps of most relevant aggregated data, including itwiki-latest-page.sql.gz (a SQL dump with the list of all pages) and itwiki-latest-categorylinks.sql.gz (a SQL dump of the categories attached to each page). You can import everything in a MySQL instance and execute a few recursive function to extract a JSON with the full hierarchy
<?php

namespace App\Console\Commands;

use Illuminate\Console\Command;
use Illuminate\Support\Facades\DB;

class ExplodeCategories extends Command
{
  protected $signature = 'explode:categories';
  protected $description = 'Creates the file for categories graph';

  private function iterate($categories, &$final)
  {
    foreach($categories as $page_id => $title) {
      if (isset($final[$title])) {
        continue;
      }

      $next_categories = [];
      $in_category = DB::connection('itwiki')->table('categorylinks')->select('cl_from')->where('cl_to', $title)->get()->map(fn($c) => $c->cl_from)->toArray();
      $in_category_count = count($in_category);
      $index = 0;
      $offset = 10000;

      while($index < $in_category_count) {
        $in_category_slice = array_slice($in_category, $index, $offset);

        /*
          Namespace 14 is for categories.
          Namespace 0 is for articles, in case you want to collect more stats
        */
        $in_category_pages = DB::connection('itwiki')->table('page')->whereIn('page_id', $in_category_slice)->where('page_namespace', 14)->get();

        foreach($in_category_pages as $p) {
          $next_categories[] = $p->page_title;
        }

        $final[$title] = $next_categories;
        $this->iterate($next_categories, $final);
        $index += $offset;
      }
    }
  }

  public function handle()
  {
    /*
      To start from the "Enciclopedia" category, which is the main root.
      37480 is his page_id
    */
    $categories = [
      37480 => 'Enciclopedia'
    ];

    $final = [];
    $this->iterate($categories, $final);
    $path = public_path('categories.json');
    $contents = json_encode($final);
    file_put_contents($path, $contents);
  }
}
From here, you have two options: crunch this in the browser, or pre-calculate a graph with the position for each node.
By paradox, the first one permits to obtain the best but the less convenient results: a WebGL JS library can leverage GPU acceleration from your PC with no effort, but has to be recalculated each time. The image published on top of this blog post has been generated after 1 hour of computation using the following script (with force-graph, the best force-directed graph renderer I've found).
import ForceGraph from 'force-graph';

fetch("/categories.json").then((res) => res.json()).then((json) => {
  let nodes = [];
  let links = [];

  for (var title in json) {
    nodes.push({
      id: title,
      name: title,
    });
  }

  for (var title in json) {
    let children = json[title];
    for (var i = 0; i < children.length; i++) {
      links.push({
        source: title,
        target: children[i],
      });
    }
  }

  const container = document.getElementById("my-target");
  const graph = ForceGraph();
  graph(container).graphData({
    nodes: nodes,
    links: links,
  })
  .d3AlphaDecay(0)
  .d3VelocityDecay(0.08)
  .cooldownTime(60000 * 60)  // ONE HOUR!
  .linkColor(() => 'rgba(0,0,0,0.05)')
  .zoom(0.05)
  .enablePointerInteraction(false);
});
For the second approach I had to dust off my modest Python, and work with two popular libraries for graphs: iGraph (with much faster force-directed algorithms) and NetworkX (with the ability to export the graph in GEXF format, to feed a SigmaJS script for visualization in browser). The following heretic implementation populates a iGraph structure, calculates his layout, and then populates another NetworkX graph with informations about calculated coordinates for each node.
import json
import igraph
import networkx as nx

json_file = 'categories.json'
with open(json_file) as json_data:
  data = json.load(json_data)

vertex = []
edges = []

for k in data:
  vertex.append(k)
  for c in data[k]:
    edges.append((k, c))

g = igraph.Graph()
g.add_vertices(vertex)
g.add_edges(edges)

layout = g.layout_fruchterman_reingold(niter=5000, start_temp=300)
coords = layout.coords

G = nx.Graph()
index = 0
for node in vertex:
  c = coords[index]
  G.add_node(node, viz = {'position': {'x': c[0], 'y': c[1]}})
  index = index + 1

for k in data:
  for c in data[k]:
    G.add_edge(k, c)

nx.write_gexf(G, "categories.gexf")
The final file can be easily loaded and almost instantly displayed in the browser (apart the time required to fetch a very large XML document...), and can be far more interactive as computation effort is quite low for the local PC.
import Graph from "graphology";
import Sigma from "sigma";
import { parse } from "graphology-gexf";

fetch("/categories.gexf").then((res) => res.text()).then((gexf) => {
  const graph = parse(Graph, gexf);
  const container = document.getElementById("my-target");
  const renderer = new Sigma(graph, container);
});
Apart the method you choose to perform the visualization, the final result is disappointing. Partly due the inestricable set of orthogonal categories that tie together semantically different portions of the graph, partly due the disparity of categorization in different areas (there are lots, lots, lots of different collections dedicated to sports, which related articles are aggregated by any possible meaning: by year, by competition, by country, by role of players and much more). In my experiments I figured out how to ignore almost 100K different categories among the most problematic ones (especially those used for internal organization, with no actual semantic meaning and connecting the graph in all possible directions), but that was absolutely not sufficient to carve out a proper tree with some kind of usefulnes.